- About us»
- Net income calculator»
- Population aging»
-
- Least developed regions»
-
- Average wage
- Material need benefits
- Meal allowance
- Counties of Slovakia
- Inflation
- Living and Subsistence Minimum
- Unemployment of Czechia and Slovakia
- NACE Classification
-
- Life expectancy
- Gender differences
- Youth unemployment and NEET
- Minimum wage in EU
- Unemployment rates of different age groups
- Share of salaries on GDP
- Unemployment rate
- Employment rate
- Percentage of employees ususally working at nights
- NEET
- Long term unemployment
-
- Bratislava and surroundings
- Kopanice
- Danube river
- lower Vah river
- middle Vár river
- upper Nitra river
- lower Nitra river
- Mining cities
- Kysuce a Orava
- upper Vah river - Liptov
- Spiš cities
- upper Hron river
- Juhoslovenská kotlina
- Košice fold and Torysa river
- upper Zemplín
- lower Zemplín
- EU regions
- NUTS3 regions of Slovakia
- LAU1 dataset
-
- Projects and activities
- Inclusive growth»
- Good work
- Project SKRS
- Social system – reality and vision
-
- Education of unemployed
- Young unemployed not taking part in education
- Proposal to change the system of education funding
- Library
- News»
- Contact
Age development of dentists

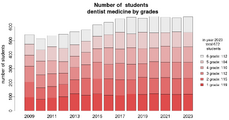
Ageing of dentists in Slovakia is visible in age group of 50-59 years, this age group is shrinking however other age groups are increasing.
| rok | less than 29 years | 30 – 39y | 40 – 49y | 50 – 59y | 60y+ | total |
|---|---|---|---|---|---|---|
| 2008 | 182 | 474 | 382 | 1123 | 584 | 2745 |
| 2009 | 210 | 442 | 338 | 1046 | 597 | 2633 |
| 2010 | 224 | 443 | 357 | 970 | 669 | 2663 |
| 2011 | 231 | 418 | 352 | 884 | 733 | 2618 |
| 2012 | 251 | 431 | 377 | 805 | 801 | 2665 |
| 2013 | 270 | 413 | 371 | 658 | 874 | 2586 |
| 2014 | 292 | 418 | 421 | 553 | 958 | 2642 |
| 2015 | 320 | 441 | 431 | 487 | 968 | 2647 |
| 2016 | 375 | 471 | 430 | 401 | 1024 | 2701 |
| 2017 | 386 | 530 | 427 | 355 | 1025 | 2723 |
| 2018 | 389 | 590 | 440 | 352 | 1008 | 2779 |
| 2019 | 462 | 635 | 469 | 327 | 960 | 2853 |
| 2020 | 445 | 706 | 478 | 354 | 904 | 2887 |
| 2021 | 439 | 723 | 478 | 359 | 876 | 2875 |
| 2022 | 442 | 837 | 484 | 380 | 829 | 2972 |
| 2023 | 389 | 886 | 500 | 396 | 790 | 2961 |
| Mean | 332 | 554 | 421 | 591 | 850 | 2747 |
Suggested citation: Michal Páleník: 30 graphs on ageing - Age development of dentists, IZ Bratislava, retrieved from: https://www.iz.sk/30-graphs-on-ageing/age-development-of-dentists, doi:10.5281/zenodo.6079128
 Tento článok je súčasťou projektu Politiky zamestnanosti realizovaného Inštitútom zamestnanosti. Tento projekt je podporený z Európskeho sociálneho fondu v rámci OP EVS.
https://www.iz.sk/30-graphs-on-ageing/age-development-of-dentists


 Share
Share Facebook
 Twitter
 News
News