- About us»
- Net income calculator»
- Population aging»
-
- Least developed regions»
-
- Average wage
- Material need benefits
- Meal allowance
- Counties of Slovakia
- Inflation
- Living and Subsistence Minimum
- Unemployment of Czechia and Slovakia
- NACE Classification
-
- Life expectancy
- Gender differences
- Youth unemployment and NEET
- Minimum wage in EU
- Unemployment rates of different age groups
- Share of salaries on GDP
- Long term unemployment
- Employment rate
- NEET
- Percentage of employees ususally working at nights
- Unemployment rate
-
- Bratislava and surroundings
- Kopanice
- Danube river
- lower Vah river
- middle Vár river
- upper Nitra river
- lower Nitra river
- Mining cities
- Kysuce a Orava
- upper Vah river - Liptov
- Spiš cities
- upper Hron river
- Juhoslovenská kotlina
- Košice fold and Torysa river
- upper Zemplín
- lower Zemplín
- EU regions
- NUTS3 regions of Slovakia
- LAU1 dataset
-
- Projects and activities
- Inclusive growth»
- Good work
- Project SKRS
- Social system – reality and vision
- Library
-
- Education of unemployed
- Young unemployed not taking part in education
- Proposal to change the system of education funding
- News»
- Contact
Region middle Vár river
consists of counties:

Towns
Region middle Vah river contains cities Bytča, Dubnica nad Váhom, Ilava, Nemšová, Nová Dubnica, Nové Mesto nad Váhom, Považská Bystrica, Púchov, Rajec, Rajecké Teplice, Stará Turá, Trenčianske Teplice, Trenčín, Žilina and 192 villages. Statistics on city level on unemployment are for the period of 2025-01-01, for population are fore yar 2023.
name | number of inhabitants in economically active age | number of unemployed number of unemployed women number of long-term unemployed | unemployment rate unemployment rate of women long-term unemployment rate |
|---|---|---|---|
 Žilina | 80 634 52 126 | 1 633 872 449 | 3.1 % 3.4 % 0.9 % |
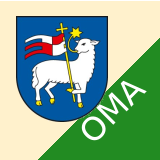 Trenčín | 54 065 34 209 | 847 462 121 | 2.5 % 2.7 % 0.4 % |
 Považská Bystrica | 37 261 24 769 | 725 341 124 | 2.9 % 2.8 % 0.5 % |
 Dubnica nad Váhom | 21 805 14 486 | 464 242 79 | 3.2 % 3.4 % 0.5 % |
 Nové Mesto nad Váhom | 19 296 12 143 | 356 217 56 | 2.9 % 3.6 % 0.5 % |
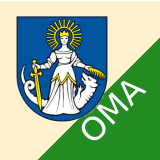 Púchov | 16 922 11 164 | 290 164 54 | 2.6 % 3 % 0.5 % |
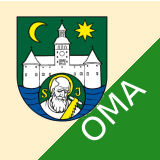 Bytča | 11 535 7 717 | 253 137 64 | 3.3 % 3.6 % 0.8 % |
 Nová Dubnica | 10 381 6 507 | 179 96 32 | 2.8 % 3 % 0.5 % |
 Stará Turá | 8 379 5 303 | 115 58 22 | 2.2 % 2.2 % 0.4 % |
 Nemšová | 6 240 4 103 | 68 34 10 | 1.7 % 1.7 % 0.2 % |
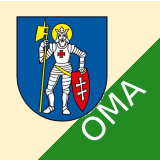 Rajec | 5 777 3 885 | 82 46 16 | 2.1 % 2.4 % 0.4 % |
 Ilava | 5 558 3 642 | 82 47 16 | 2.3 % 2.6 % 0.4 % |
 Trenčianske Teplice | 3 908 2 380 | 58 38 6 | 2.4 % 3.1 % 0.3 % |
 Rajecké Teplice | 2 847 1 837 | 44 26 16 | 2.4 % 2.9 % 0.9 % |
Villages with over 2000 inhabitants are Beluša (6199), Teplička nad Váhom (4345), Trenčianska Teplá (4211), Terchová (3997), Štiavnik (3974), Lednické Rovne (3935), Varín (3905), Čachtice (3654), Veľké Rovné (3652), Trenčianska Turná (3549), Trenčianske Stankovce (3408), Rosina (3360), Belá (3314), Horná Súča (3275), Dolná Súča (3063), Višňové (2992), Košeca (2739), Horné Srnie (2688), Strečno (2589), Moravské Lieskové (2524), Ladce (2489), Divina (2445), Soblahov (2415), Papradno (2390), Pruské (2310), Udiča (2226), Drietoma (2222), Kotešová (2206), Turie (2080), Pružina (2065), Lysá pod Makytou (2053), Bzince pod Javorinou (2035).
| villages by number of inhabitants | ||||||
|---|---|---|---|---|---|---|
| total | up to 300 | 300 to 500 | 500 to 1000 | 1000 to 1500 | over 1500 | |
| 192 | 19 | 20 | 60 | 37 | 56 | |
Unemployment

| rok | 2012 | 2014 | 2016 | 2018 | 2019 | 2020 | 2021 | 2022 | 2023 | 2024 | 2025 |
|---|---|---|---|---|---|---|---|---|---|---|---|
| number of unemployed | 26 996 | 26 318 | 18 708 | 9955 | 9704 | 13 863 | 14 163 | 11 279 | 10 163 | 9562 | 9514 |
| number of long-term unemployed | 10 204 | 11 482 | 7044 | 2437 | 1842 | 2423 | 4203 | 3419 | 2503 | 2228 | 1982 |
| number of people receiving social benefits | 13 717 | 11 886 | 5746 | 3247 | 2655 | 2569 | 2398 | 3215 | 3190 | 2671 | 2490 |
| number of activational workers | 885 | 949 | 553 | 229 | 162 | 186 | 163 | 145 | 38.5 | 85.5 | 82.5 |
| unemployment rate | 7.1 | 7 | 5 | 2.7 | 2.7 | 3.9 | 4 | 3.2 | 2.9 | 2.8 | 2.8 |
| long-term unemployment rate | 2.7 | 3.0 | 1.9 | 0.7 | 0.5 | 0.7 | 1.2 | 1.0 | 0.7 | 0.6 | 0.6 |
| vacancies | 650 | 782 | 5190 | 10 472 | 12 933 | 9403 | 8582 | 9947 | 7709 | 9420 | 11 485 |
Demographics

| 2012 | 2014 | 2016 | 2018 | 2019 | 2020 | 2021 | 2022 | 2023 | 2024 | 2025 | |
|---|---|---|---|---|---|---|---|---|---|---|---|
| number of inhabitants | 530 161 | 530 972 | 531 211 | 531 781 | 532 163 | 531 861 | 530 098 | 528 732 | 527 627 | 527 627 | 527 627 |
| assignation tax | 121 363 501 | 124 474 537 | 150 639 347 | 185 370 268 | 209 853 532 | 216 993 401 | 209 430 852 | 232 070 915 | 261 258 711 | 260 921 610 | 212 719 974 |
| demographic dependency | 20.7 | 22.0 | 23.9 | 25.9 | 27.1 | 28.2 | 29.1 | 30.2 | 32.0 | ||
| number of employed foreigners | 1462 | 1454 | 2125 | 5756 | 8677 | 8528 | 7402 | 8380 | 9630 | 10 274 | 11 520 |

Number of unemployed
| rok | 2012 | 2014 | 2016 | 2018 | 2019 | 2020 | 2021 | 2022 | 2023 | 2024 | 2025 |
|---|---|---|---|---|---|---|---|---|---|---|---|
| less than 24 years | 6162 | 4847 | 2799 | 1231 | 1166 | 1725 | 1567 | 1236 | 1159 | 1189 | 1122 |
| 25 to 39 years | 10 573 | 9066 | 6690 | 3585 | 3519 | 4929 | 4895 | 3962 | 3570 | 3439 | 3598 |
| 40 to 54 years | 10 116 | 8366 | 5977 | 3105 | 3078 | 4520 | 4658 | 3735 | 3414 | 3272 | 3347 |
| 55 years and more | 4275 | 4038 | 3242 | 2034 | 1941 | 2688 | 3044 | 2345 | 2020 | 1662 | 1607 |
Other regions
- Basic data on Slovak regions
- Labour market indicators of slovak regions.
- Region Bratislava and surroundings
- Region Kopanice
- Region Danube river
- Region lower Vah river
- Region middle Vár river
- Region upper Nitra river
- Region lower Nitra river
- Region Mining cities
- Region Kysuce a Orava
- Region upper Vah river – Liptov
- Region Spiš cities
- Region upper Hron river
- Region Juhoslovenská kotlina
- Region Košice fold and Torysa river
- Region upper Zemplín
- Region lower Zemplín

Suggested citation: Michal Páleník: Regions of Slovakia - Region middle Vár river, IZ Bratislava, retrieved from: https://www.iz.sk/en/projects/regions-of-slovakia/middle-vah-river
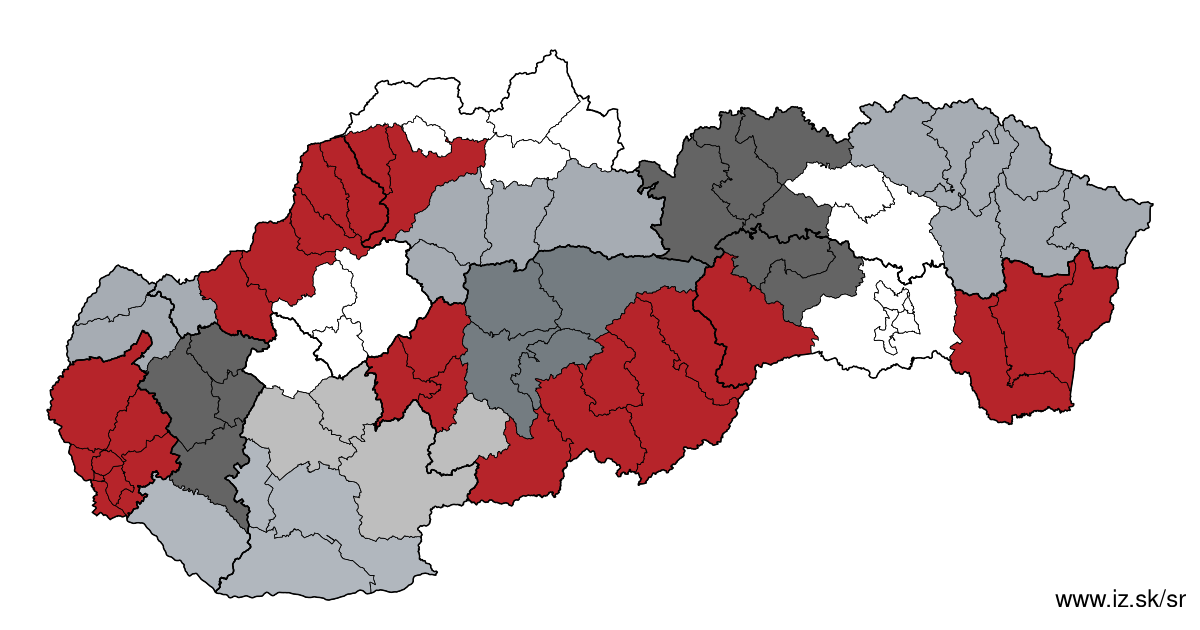
Regions of the Slovak Republic
Due to the need of analysis we have created regions of Slovakia. We will bring more information about these regions from the macroeconomic point of view as well as from the point of view of the labour market.. . .

 Share
Share Facebook
 Twitter
 News
News