- About us»
- Net income calculator»
- Population aging»
-
- Least developed regions»
-
- Average wage
- Material need benefits
- Meal allowance
- Counties of Slovakia
- Inflation
- Living and Subsistence Minimum
- Unemployment of Czechia and Slovakia
- NACE Classification
-
- Life expectancy
- Gender differences
- Youth unemployment and NEET
- Minimum wage in EU
- Unemployment rates of different age groups
- Share of salaries on GDP
- Long term unemployment
- Employment rate
- NEET
- Percentage of employees ususally working at nights
- Unemployment rate
-
- Bratislava and surroundings
- Kopanice
- Danube river
- lower Vah river
- middle Vár river
- upper Nitra river
- lower Nitra river
- Mining cities
- Kysuce a Orava
- upper Vah river - Liptov
- Spiš cities
- upper Hron river
- Juhoslovenská kotlina
- Košice fold and Torysa river
- upper Zemplín
- lower Zemplín
- EU regions
- NUTS3 regions of Slovakia
- LAU1 dataset
-
- Projects and activities
- Inclusive growth»
- Good work
- Project SKRS
- Social system – reality and vision
- Library
-
- Education of unemployed
- Young unemployed not taking part in education
- Proposal to change the system of education funding
- News»
- Contact
Region upper Vah river - Liptov
consists of counties:

Towns
Region upper Vah river – Liptov contains cities Liptovský Hrádok, Liptovský Mikuláš, Martin, Ružomberok, Turany, Turčianske Teplice, Vrútky and 143 villages. More on oma.sk. Statistics on city level on unemployment are for the period of 2025-01-01, for population are fore yar 2023.
name | number of inhabitants in economically active age | number of unemployed number of unemployed women number of long-term unemployed | unemployment rate unemployment rate of women long-term unemployment rate |
|---|---|---|---|
 Martin | 50 629 33 045 | 944 452 180 | 2.9 % 2.7 % 0.5 % |
 Liptovský Mikuláš | 30 040 19 446 | 809 412 221 | 4.2 % 4.2 % 1.1 % |
 Ružomberok | 26 548 17 266 | 753 339 269 | 4.4 % 3.9 % 1.6 % |
 Vrútky | 7 399 4 765 | 170 83 38 | 3.6 % 3.5 % 0.8 % |
 Liptovský Hrádok | 7 003 4 490 | 153 80 54 | 3.4 % 3.6 % 1.2 % |
 Turčianske Teplice | 6 178 3 953 | 164 74 58 | 4.1 % 3.9 % 1.5 % |
 Turany | 4 107 2 690 | 69 22 13 | 2.6 % 1.7 % 0.5 % |
Villages with over 2000 inhabitants are Sučany (4758), Liptovské Sliače (3761), Likavka (2945), Liptovská Lúžna (2757), Važec (2374), Východná (2226), Lisková (2056).
| villages by number of inhabitants | ||||||
|---|---|---|---|---|---|---|
| total | up to 300 | 300 to 500 | 500 to 1000 | 1000 to 1500 | over 1500 | |
| 143 | 47 | 23 | 33 | 25 | 15 | |
Unemployment

| rok | 2012 | 2014 | 2016 | 2018 | 2019 | 2020 | 2021 | 2022 | 2023 | 2024 | 2025 |
|---|---|---|---|---|---|---|---|---|---|---|---|
| number of unemployed | 15 753 | 14 960 | 10 565 | 6286 | 5808 | 7696 | 8333 | 7002 | 6317 | 5856 | 5770 |
| number of long-term unemployed | 7244 | 7385 | 4494 | 2045 | 1564 | 1779 | 2813 | 2474 | 2073 | 1902 | 1689 |
| number of people receiving social benefits | 9951 | 8938 | 5310 | 3477 | 3025 | 2913 | 2695 | 3273 | 3361 | 3090 | 2874 |
| number of activational workers | 1100 | 1184 | 594 | 366 | 299 | 282 | 248 | 250 | 75.4 | 153 | 118 |
| unemployment rate | 9 | 8.7 | 6.3 | 3.8 | 3.6 | 4.8 | 5.3 | 4.5 | 4.1 | 3.8 | 3.7 |
| long-term unemployment rate | 4.1 | 4.3 | 2.7 | 1.2 | 1.0 | 1.1 | 1.8 | 1.6 | 1.3 | 1.2 | 1.1 |
| vacancies | 243 | 458 | 1486 | 2328 | 2616 | 2430 | 1974 | 2170 | 1466 | 2062 | 2158 |
Demographics

| 2012 | 2014 | 2016 | 2018 | 2019 | 2020 | 2021 | 2022 | 2023 | 2024 | 2025 | |
|---|---|---|---|---|---|---|---|---|---|---|---|
| number of inhabitants | 243 888 | 243 007 | 242 140 | 241 445 | 240 924 | 240 365 | 238 385 | 237 491 | 236 687 | 236 687 | 236 687 |
| assignation tax | 64 851 605 | 61 211 815 | 73 920 986 | 88 791 515 | 99 832 868 | 103 183 118 | 99 055 175 | 109 413 284 | 122 664 103 | 122 986 682 | 101 593 102 |
| demographic dependency | 21.2 | 22.9 | 25.2 | 27.6 | 28.9 | 30.1 | 30.8 | 32.0 | 33.0 | ||
| number of employed foreigners | 186 | 260 | 433 | 665 | 923 | 1125 | 1002 | 1349 | 1524 | 1780 | 1894 |

Number of unemployed
| rok | 2012 | 2014 | 2016 | 2018 | 2019 | 2020 | 2021 | 2022 | 2023 | 2024 | 2025 |
|---|---|---|---|---|---|---|---|---|---|---|---|
| less than 24 years | 3625 | 2706 | 1625 | 861 | 815 | 1131 | 1132 | 850 | 830 | 819 | 780 |
| 25 to 39 years | 6112 | 5112 | 3583 | 2099 | 1953 | 2656 | 2819 | 2317 | 2049 | 1958 | 1906 |
| 40 to 54 years | 5946 | 4938 | 3511 | 2074 | 1899 | 2416 | 2684 | 2378 | 2171 | 2010 | 2059 |
| 55 years and more | 2419 | 2205 | 1846 | 1252 | 1142 | 1494 | 1698 | 1457 | 1267 | 1068 | 1053 |
Other regions
- Basic data on Slovak regions
- Labour market indicators of slovak regions.
- Region Bratislava and surroundings
- Region Kopanice
- Region Danube river
- Region lower Vah river
- Region middle Vár river
- Region upper Nitra river
- Region lower Nitra river
- Region Mining cities
- Region Kysuce a Orava
- Region upper Vah river – Liptov
- Region Spiš cities
- Region upper Hron river
- Region Juhoslovenská kotlina
- Region Košice fold and Torysa river
- Region upper Zemplín
- Region lower Zemplín

Suggested citation: Michal Páleník: Regions of Slovakia - Region upper Vah river - Liptov, IZ Bratislava, retrieved from: https://www.iz.sk/en/projects/regions-of-slovakia/upper-vah-river-liptov
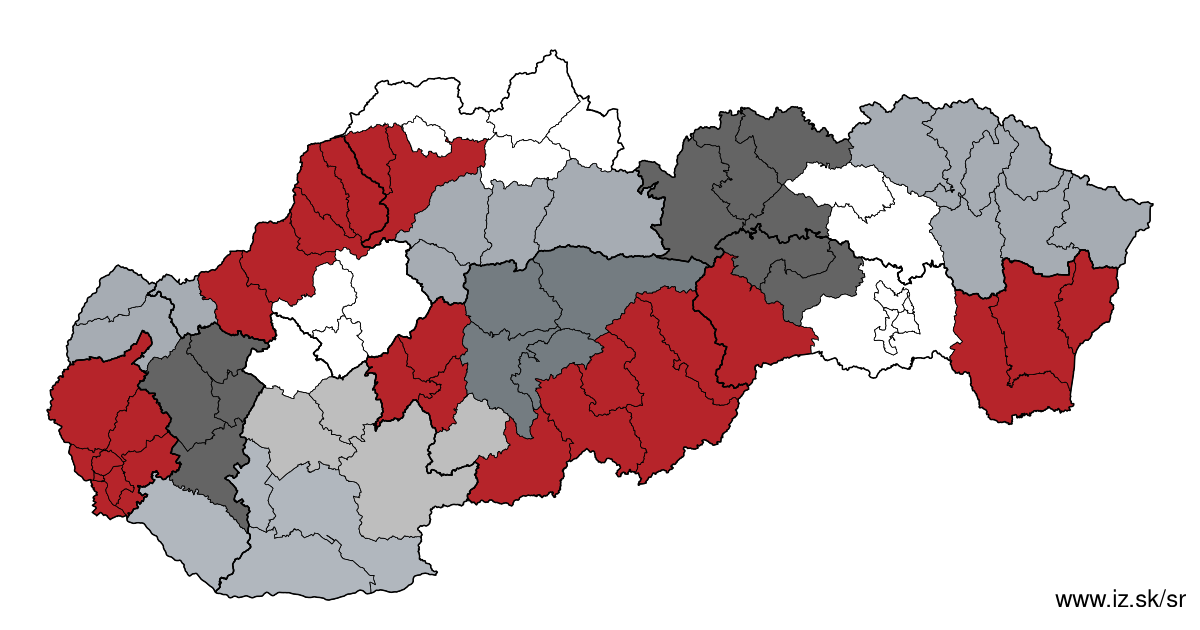
Regions of the Slovak Republic
Due to the need of analysis we have created regions of Slovakia. We will bring more information about these regions from the macroeconomic point of view as well as from the point of view of the labour market.. . .

 Share
Share Facebook
 Twitter
 News
News