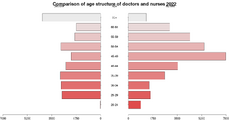
Age structure of nurses

Age structure of nurses in years 2015 and 2022 according to gender.
| age | male 2015 | female 2015 | total 2015 | male 2023 | female 2023 | total 2023 | total |
|---|---|---|---|---|---|---|---|
| 20-24 | 33 | 693 | 726 | 31 | 850 | 881 | 1607 |
| 25-29 | 79 | 1422 | 1501 | 78 | 1497 | 1575 | 3076 |
| 30-34 | 127 | 2384 | 2511 | 103 | 1386 | 1489 | 4000 |
| 35-39 | 113 | 4779 | 4892 | 120 | 2478 | 2598 | 7490 |
| 40-44 | 90 | 5791 | 5881 | 115 | 3423 | 3538 | 9419 |
| 45-49 | 38 | 4577 | 4615 | 138 | 6848 | 6986 | 11 601 |
| 50-54 | 44 | 4346 | 4390 | 77 | 5352 | 5429 | 9819 |
| 55-59 | 33 | 4072 | 4105 | 42 | 4374 | 4416 | 8521 |
| 60-64 | 9 | 1710 | 1719 | 26 | 2941 | 2967 | 4686 |
| 65+ | 9 | 555 | 564 | 7 | 1288 | 1295 | 1859 |
| Total | 575 | 30 329 | 30 904 | 737 | 30 437 | 31 174 | 62 078 |
Suggested citation: Michal Páleník: 30 graphs on ageing - Age structure of nurses, IZ Bratislava, retrieved from: https://www.iz.sk/30-graphs-on-ageing/age-structure-of-nurses, doi:10.5281/zenodo.6079128
https://www.iz.sk/30-graphs-on-ageing/age-structure-of-nurses
 Share
Share Facebook
 Twitter
 News
News