- About us»
- Net income calculator»
- Population aging»
-
- Least developed regions»
-
- Average wage
- Material need benefits
- Meal allowance
- Counties of Slovakia
- Inflation
- Living and Subsistence Minimum
- Unemployment of Czechia and Slovakia
- NACE Classification
-
- Life expectancy
- Gender differences
- Youth unemployment and NEET
- Minimum wage in EU
- Unemployment rates of different age groups
- Share of salaries on GDP
- Employment rate
- NEET
- Unemployment rate
- Long term unemployment
- Percentage of employees ususally working at nights
-
- Bratislava and surroundings
- Kopanice
- Danube river
- lower Vah river
- middle Vár river
- upper Nitra river
- lower Nitra river
- Mining cities
- Kysuce a Orava
- upper Vah river - Liptov
- Spiš cities
- upper Hron river
- Juhoslovenská kotlina
- Košice fold and Torysa river
- upper Zemplín
- lower Zemplín
- EU regions
- NUTS3 regions of Slovakia
- LAU1 dataset
-
- Projects and activities
- Inclusive growth»
- Good work
- Project SKRS
- Social system – reality and vision
- Library
-
- Education of unemployed
- Young unemployed not taking part in education
- Proposal to change the system of education funding
- News»
- Contact
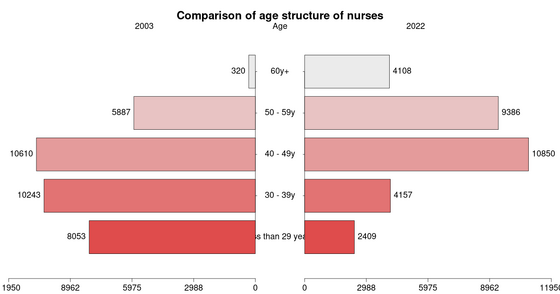
Comparison of age structure of nurses

We can observe a dramatic shift in the age structure of nurses. Number of nurses in the age group of 50 years and older is rising and number of nurses in below 30 years shrunk to one third.
| vek | 2003 | 2024 | increase | increase in % |
|---|---|---|---|---|
| less than 29 years | 8053 | 2589 | -5464 | -68 % |
| 30 – 39y | 10 243 | 3801 | -6442 | -63 % |
| 40 – 49y | 10 610 | 10 258 | -352 | -3 % |
| 50 – 59y | 5887 | 10 354 | 4467 | 76 % |
| 60y+ | 320 | 4393 | 4073 | 1273 % |
| Total | 35 113 | 31 395 | -3718 | -12 % |
Suggested citation: Michal Páleník: 30 graphs on ageing - Comparison of age structure of nurses, IZ Bratislava, retrieved from: https://www.iz.sk/30-graphs-on-ageing/comparison-of-age-structure-of-nurses, doi:10.5281/zenodo.6079128
 Tento článok je súčasťou projektu Politiky zamestnanosti realizovaného Inštitútom zamestnanosti. Tento projekt je podporený z Európskeho sociálneho fondu v rámci OP EVS.
https://www.iz.sk/30-graphs-on-ageing/comparison-of-age-structure-of-nurses


 Share
Share Facebook
 Twitter
 News
News