- About us»
- Net income calculator»
- Population aging»
-
- Least developed regions»
-
- Average wage
- Material need benefits
- Meal allowance
- Counties of Slovakia
- Inflation
- Living and Subsistence Minimum
- Unemployment of Czechia and Slovakia
- NACE Classification
-
- Life expectancy
- Gender differences
- Youth unemployment and NEET
- Minimum wage in EU
- Unemployment rates of different age groups
- Share of salaries on GDP
- Long term unemployment
- Employment rate
- Percentage of employees ususally working at nights
- NEET
- Unemployment rate
-
- Bratislava and surroundings
- Kopanice
- Danube river
- lower Vah river
- middle Vár river
- upper Nitra river
- lower Nitra river
- Mining cities
- Kysuce a Orava
- upper Vah river - Liptov
- Spiš cities
- upper Hron river
- Juhoslovenská kotlina
- Košice fold and Torysa river
- upper Zemplín
- lower Zemplín
- EU regions
- NUTS3 regions of Slovakia
- LAU1 dataset
-
- Projects and activities
- Inclusive growth»
- Good work
- Project SKRS
- Social system – reality and vision
-
- Education of unemployed
- Young unemployed not taking part in education
- Proposal to change the system of education funding
- Library
- News»
- Contact
Comparison of age structure of doctors

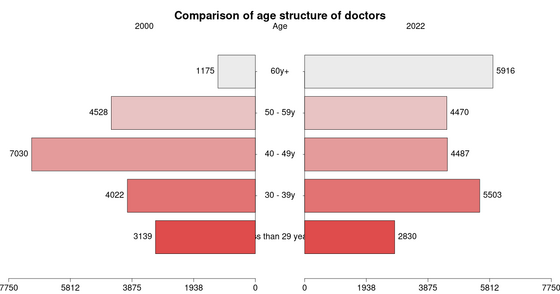
We can observe a shift in the age structure of doctors. Number of doctors between 40 and 49 years decreased whilst number of doctors above the age of 60 increased.
| vek | 2000 | 2023 | increase | increase in % |
|---|---|---|---|---|
| less than 29 years | 3139 | 2790 | -349 | -11 % |
| 30 – 39y | 4022 | 5717 | 1695 | 42 % |
| 40 – 49y | 7030 | 4601 | -2429 | -35 % |
| 50 – 59y | 4528 | 4703 | 175 | 4 % |
| 60y+ | 1175 | 5903 | 4728 | 402 % |
| Total | 19 894 | 23 714 | 3820 | 16 % |
Suggested citation: Michal Páleník: 30 graphs on ageing - Comparison of age structure of doctors, IZ Bratislava, retrieved from: https://www.iz.sk/30-graphs-on-ageing/comparison-of-age-structure-of-doctors, doi:10.5281/zenodo.6079128
 Tento článok je súčasťou projektu Politiky zamestnanosti realizovaného Inštitútom zamestnanosti. Tento projekt je podporený z Európskeho sociálneho fondu v rámci OP EVS.
https://www.iz.sk/30-graphs-on-ageing/comparison-of-age-structure-of-doctors


 Share
Share Facebook
 Twitter
 News
News